
Power BI for small and mid-sized businesses
Big-company analytics, sized for growing businesses
We build Power BI dashboards that refresh on their own, so your team can stop rebuilding reports by hand and spend that time acting on the numbers.
Big-company experience, for businesses your size
20+ years
of international data and BI experience across our consultant network
1,500–3,000+
people using Power BI solutions built for large companies by consultants in our network
4 billion+
rows of data in models tuned to answer in under a second
These figures cover the combined experience of consultants in our network, including work done before they worked with Growinnoz or as subcontractors.
From spreadsheets to decisions
You probably have the data already. The hard part is getting it in one place and trusting what it says.
Reports rebuilt by hand every month
Reports that refresh on their own
Data spread across Excel and separate systems
All your numbers in one place
Generic reports nobody opens
Dashboards built around the numbers you care about
Dashboards only one person understands
A team that knows how to use Power BI
What we do
Custom Power BI dashboards
Dashboards and scorecards built around the numbers you run the business on.
Data integration and automation
We connect your systems so reports update without anyone touching them.
Data analysis and forecasting
See what happened, what’s likely next and what to do about it.
Consulting and training
Hands-on workshops and advice, so your team can use the data without us.
Data engineering and modernization
For bigger jobs, like moving to the cloud or replacing old reporting systems.
IT talent sourcing
Need someone on your team? We find and screen tech people for full-time and contract roles.
Selected projects
A few examples of work by consultants in our network. We’ve removed client names and figures from these screenshots.
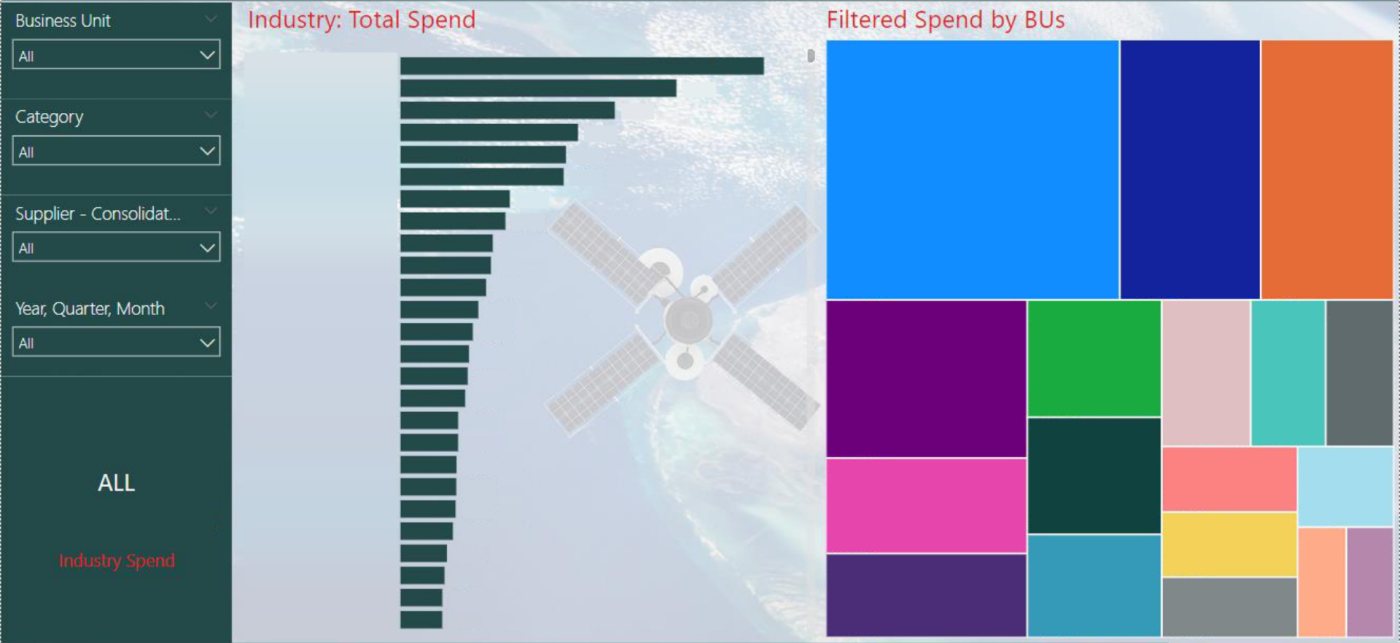
Spend analytics
Shows where the money goes by supplier, category and business unit.
USA · SharePoint data
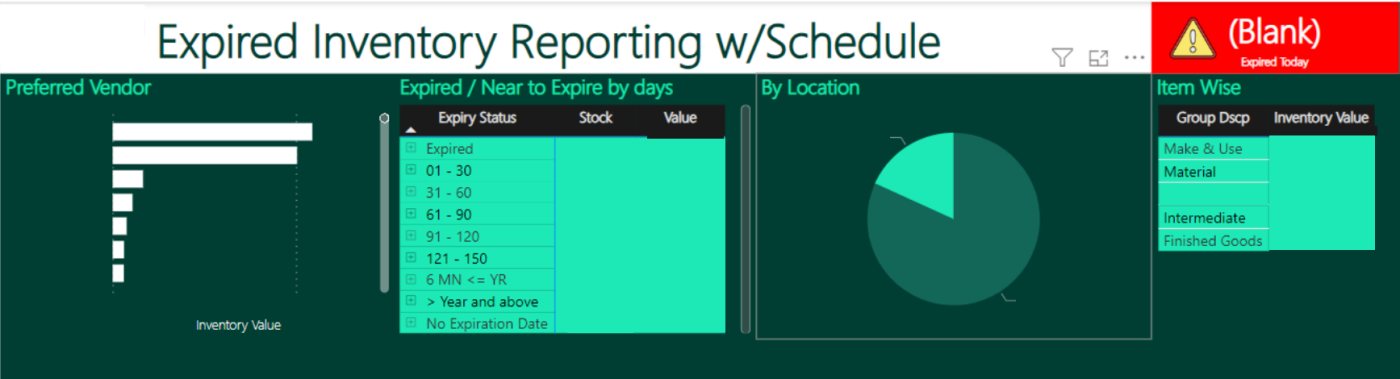
Expired inventory reporting
Shows which stock has expired or soon will, all in one view.
USA · SAP S/4HANA
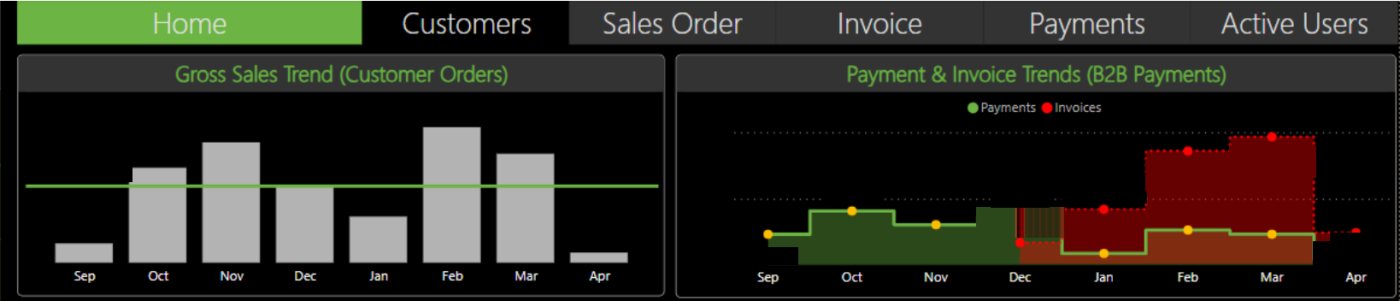
Orders, invoices and payments
Tracks orders, invoices and B2B payments together.
Australia · Snowflake
How it works
Consultation
We talk through your goals, your data and the decisions you’re trying to make.
Solution design
We agree what to measure, where the data comes from, what’s included and when it’ll be ready.
Build and test
We connect your data, build it and check it does what you need.
Launch and support
We hand it over, show your team how it works and stay on for support.
Industry experience
- Banking
- Retail
- Transportation
- Education
- Healthcare
- Public sector
Not sure where to start?
Tell us which report eats up the most time. We’ll take a look and tell you what we’d do.
Growinnoz
Custom Power BI dashboards, data solutions and IT talent for small and mid-sized businesses.
Company
Get in touch
- info@growinnoz.com
- Hamilton, Canada · Karachi, Pakistan